Hi-C quality check
The file is organized in 4 lines per read: 1. starting with @, the
header of the DNA sequence with the read id (plus optional fields) 2.
the DNA sequence 3. starting with +, the header of the sequence
quality (this line could be either a repetition of first line or empty)
4. the sequence quality (it is provided as PHRED score and it is not
human readable. Check https://en.wikipedia.org/wiki/Phred_quality_score
for more details)
%%bash

dsrc d -s FASTQs/mouse_B_rep1_1.fastq.dsrc | head -n 8
@SRR5344921.1
ACCACTGATGGCACCACTGTTGTACTTTAGGATCGATCACTCCTTATACGCACATAGGAAACACTGACTAGAGGG
+
@B@B@>1>=;1@EG0B0;1=E1:>>1111<?=1E9=0><C:<>11=11?1=ECDC1>1=@FD1<:1?C#######
@SRR5344921.2
GGGCTTTTTTTGGCTGGGAGACTATTTATAACTGCTTCTATTTCTTTAGGGGATATGGGACTGTTTAGAAGGTCA
+
BCCBBFGGGG@GEGGGGDGEBGEF@<1FGGEFGGECGG@FEGGGEG>@1=09/BFGGEG111C<F1>11BGF1=1
Count the number of lines in the file (4 times the number of reads)
%%bash

dsrc d -s FASTQs/mouse_B_rep1_1.fastq.dsrc | wc -l
400000000
There are 400 M lines in the file, which means 100M reads in total.
Quality check before mapping
Check restriction-enzyme used
Most important to analyze Hi-C dataset is the restriction enzyme used in the experiment. TADbit provides a simple function to check for it:
from pytadbit.mapping.restriction_enzymes import identify_re
pat, enz, pv = identify_re('FASTQs/mouse_B_rep1_1.fastq.dsrc')

print('- Most probable pattern: %s, matching enzymes: %s' % (pat, ','.join(enz)))
- Most probable pattern: GATC, matching enzymes: BssMI,DpnII,Sau3AI,MboI,Kzo9I,Bsp143I,NdeII,BstMBI,BfuCI
Plot PHRED score and ligation/digestion sites
In order to quickly assess the quality of the HiC experiment (before mapping), and given that we know the restriction enzyme used, we can check the proportion of reads with ligation sites as well as the number of reads starting by a cut-site.
These numbers will give us a first hint on the efficiencies of two critical steps in the HiC experiment, the digestion and the ligation.
from pytadbit.utils.fastq_utils import quality_plot
r_enz = 'MboI'
cell = 'B'
repl = 'rep1'
The plot on the top represents the typical per nucleotide quality
profile of NGS reads, with, in addition, the proportion of N found
at each position.
The second plot, is specific to Hi-C experiments. Given a restriction enzyme the function searches for the presence of ligation sites and of undigested restriction enzyme sites. Depending on the enzyme used the function can differentiate between dangling-ends and undigested sites.
From these proportions some quality statistics can be inferred before mapping: - The PHRED score and the number of unidentified nucleotides (Ns) in the read sequence, which are routinely computed to address the quality of high-throughput sequencing experiments. - The numbers of undigested and unligated RE sites per-nucleotide along the read to assess the quality of the Hi-C experiment. - The overall percentage of digested sites, which relates directly to the RE efficiency. - The percentage of non-ligated digested (dangling-ends), which relates to the ligation efficiency. - The percentage of read-ends with a ligation site, which is negatively correlated with the percentage of dangling-ends.
quality_plot('FASTQs/mouse_{0}_{1}_1.fastq.dsrc'.format(cell, repl), r_enz=r_enz, nreads=1000000)
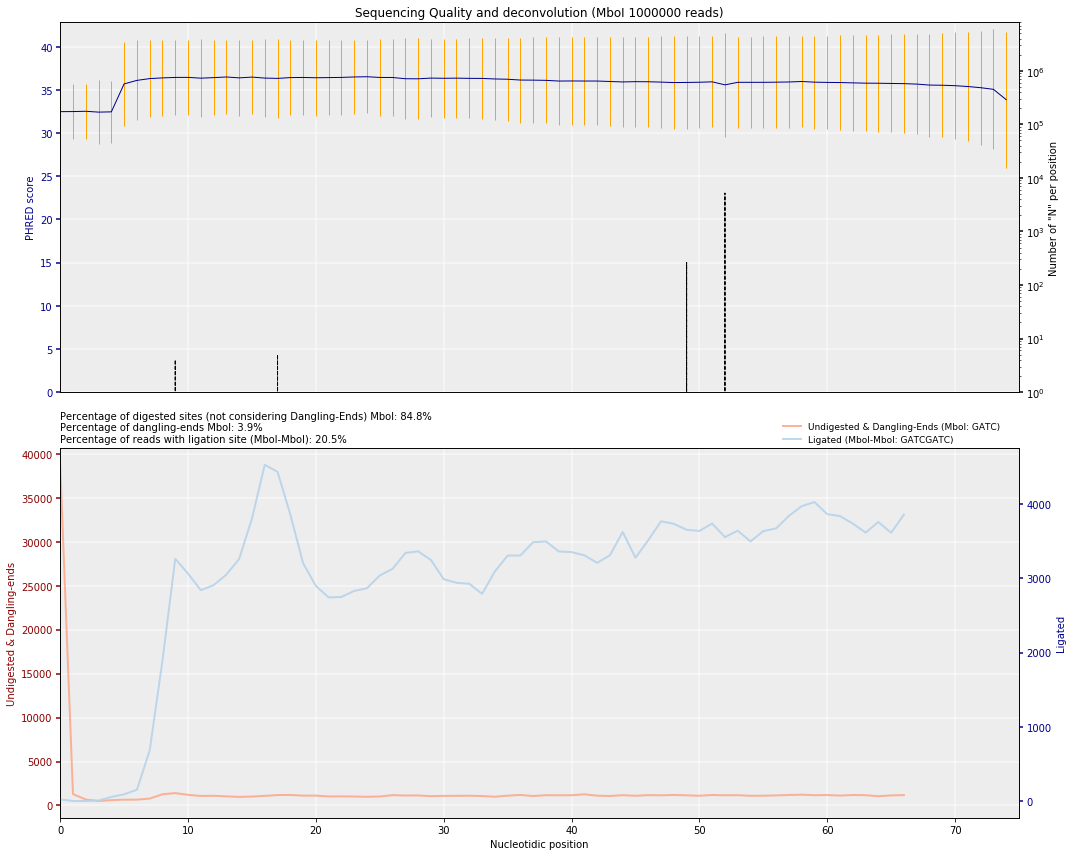
({'MboI': 3.8757}, {('MboI', 'MboI'): 20.5069})
Note: this plot iscompatible with the use of multiple restriction enzymes(which is why the ligation site is labeled as MboI-MboI)
